06/04/2026
I. Market Review & Current Structure
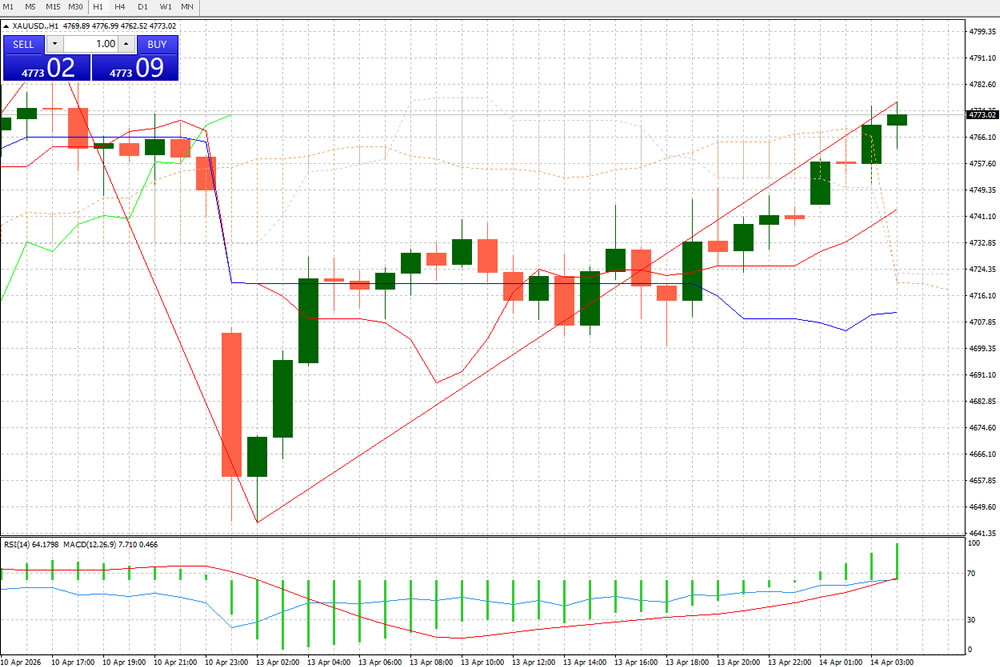
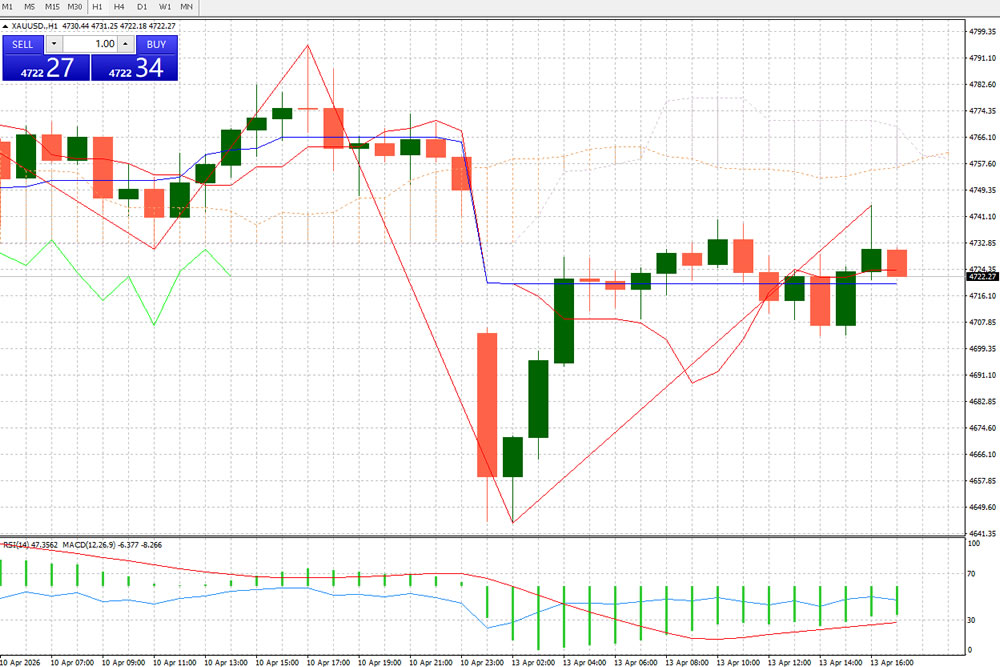
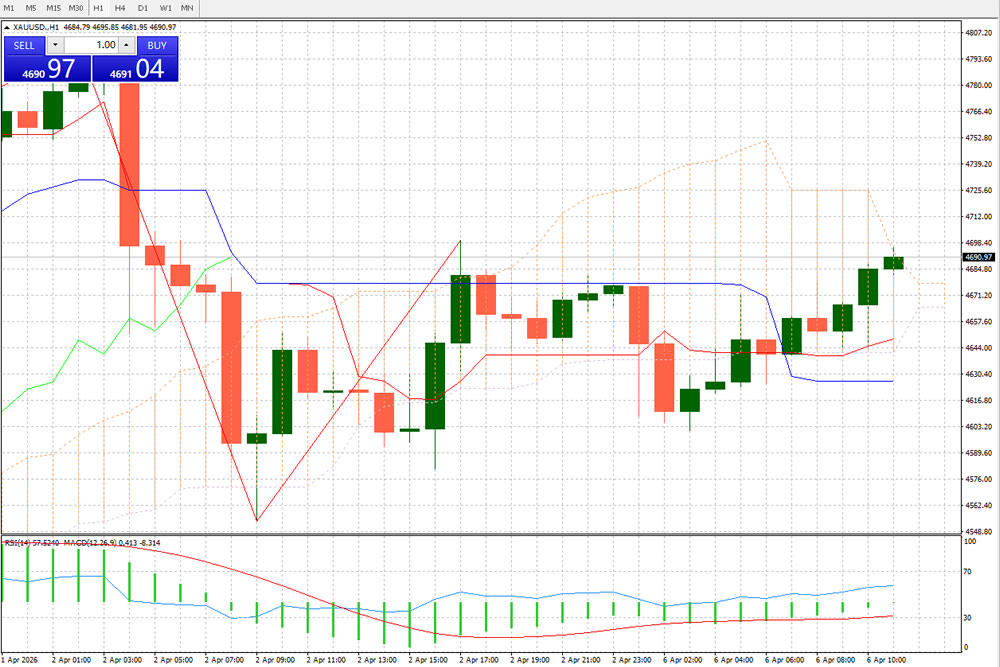
Today’s 1-hour XAU/USD chart shows a clear pattern of deep correction, range-bound consolidation, and subsequent bullish rebound: In the early session, gold price plunged sharply from above 4780, hitting a local low near 4596 to complete a round of deep adjustment. Then the price entered a range-bound repair phase, fluctuating between 4600 and 4680 as long and short forces rebalanced. As of now, XAU/USD has successfully broken through the upper bound of the consolidation range, reaching a high of 4690.97, returning to a strong upward channel with the current quote at 4690.97, and bullish momentum has recovered significantly.
II. Core Technical Indicator Analysis
- Price Structure & Trend
The previous downtrend has shown a clear reversal signal: The price rebounded from the 4596 local low, breaking through key resistances such as 4630 and 4660 step by step. The 1-hour candlestick presents a bullish arrangement with rising lows and highs, and the short-term uptrend is officially established.
Key Support & Resistance:
1st Support: 4670-4675 (upper bound of the previous consolidation range, turned into strong support after breakout)
2nd Support: 4650 (recent rebound pivot, bullish defense level)
1st Resistance: 4700 psychological integer level (dual pressure of psychology and technology)
2nd Resistance: 4725-4730 (upper bound of the previous consolidation platform, medium-term strong resistance)
- RSI Indicator
The current 1-hour RSI is 57.52, in the neutral-to-strong range of 50-70, not entering the overbought zone. This indicates that bullish momentum still has room for release, with no extreme overheating signal, and the short-term uptrend has continuity. If RSI breaks above 70, a correction risk should be warned; if it falls back below 50, the trend will weaken. - MACD Indicator
The MACD shows a sustained uptrend after a golden cross: The DIF line (0.513) is above the DEA line (-8.314), and the red histogram continues to expand, indicating that bullish momentum is continuously increasing. The short-term uptrend is confirmed by volume, with no obvious top divergence, and the upward structure is healthy. - Channel Indicator (Bollinger Bands-like)
The current price is running near the upper band of the channel, and the channel is generally opening upward, indicating a strong short-term bullish trend. The price moving along the upper band is a strong upward structure; meanwhile, the middle band of the channel is moving upward synchronously, providing dynamic support for the price, further confirming the trend strength.
III. Trading Strategy & Operation Suggestions
- Trend Direction Judgment
In the short term (1-hour timeframe), we are clearly bullish on gold. XAU/USD is in the upward cycle after correction, with bulls dominating the market. Operations should focus on buying the dips, and chasing highs should be cautious. - Entry Strategy
Long Positions:
Aggressive: Go long when the price stabilizes in the 4670-4675 range, stop loss at 4660, target 4695-4700, and further target 4720-4725 after breakout.
Conservative: Go long when the price pulls back to the 4650-4655 range, stop loss at 4640, target 4680-4690, and further target 4700-4720 after breakout.
Short Positions:
Only recommend ultra-short-term speculation: Lightly short when the price hits the 4700-4705 range with obvious stagnation and overbought signals, stop loss at 4715, target 4680-4675. Strictly control the position and do not hold short positions overnight.
- Risk Warnings
Focus on the breakthrough of the 4700 integer level. If it fails to break through effectively, gold price will likely enter range-bound consolidation, and the strategy needs to be adjusted in a timely manner.
Macro data (such as US non-farm payrolls, inflation data), geopolitical events may trigger sharp fluctuations in gold price. Strictly set stop loss and control position.
The 1-hour timeframe is a short-term trend. It is necessary to confirm the general direction with 4-hour and daily trends to avoid contrarian operations.
[Disclaimer] Forex trading involves risk; please invest with caution. This content is for informational purposes and objective analysis only, and does not constitute any investment advice, basis for buying/selling, or guarantee of returns. Investors should make independent decisions based on their own financial situation and risk tolerance, and bear their own investment risks.